Numerical
Computations for Mixed Solid/Fluid Interaction
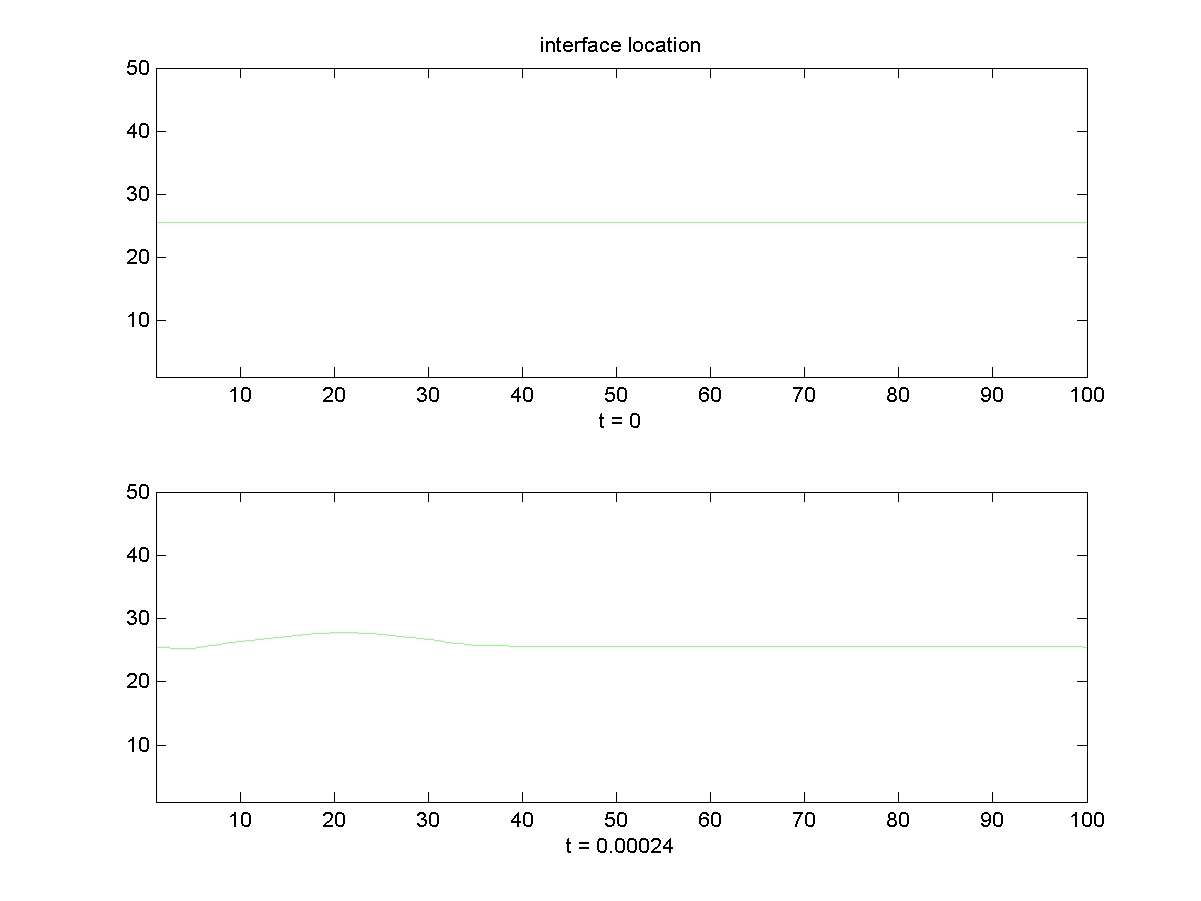
Figure 1. This shows the interface
between a solid above a gas. The top picture shows the initial simple configuration
and the bottom show the interface at time t=.00024. Notice the deformation
of the solid.
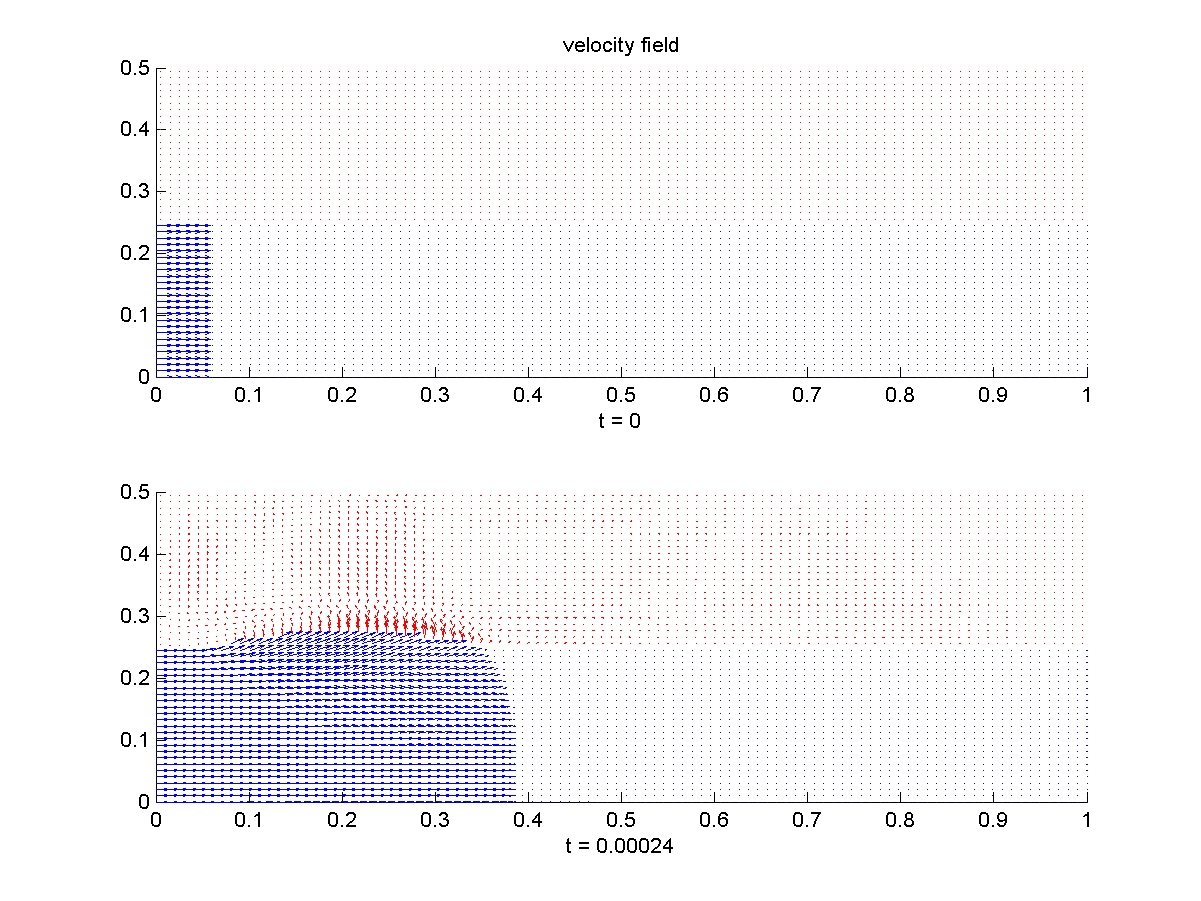
Figure 2. This figure shows
the velocity field associtaed with Figure 1. Notice the planar shock at t=0
(top)
and the velocity field at t=0.00024 (bottom).
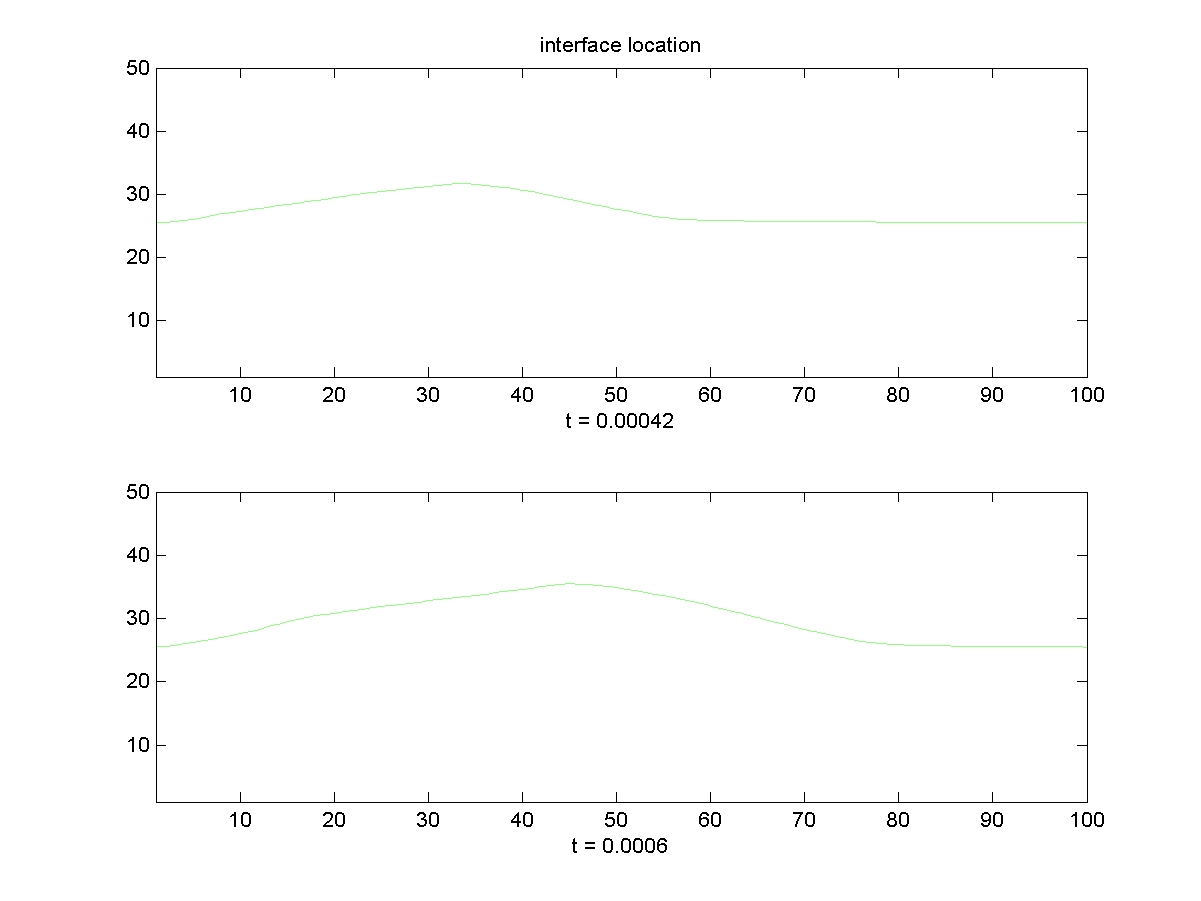
Figure 3. This case shows a
more interesting initial interface (top) and its deformation at later time (bottom,
t=0.0006).
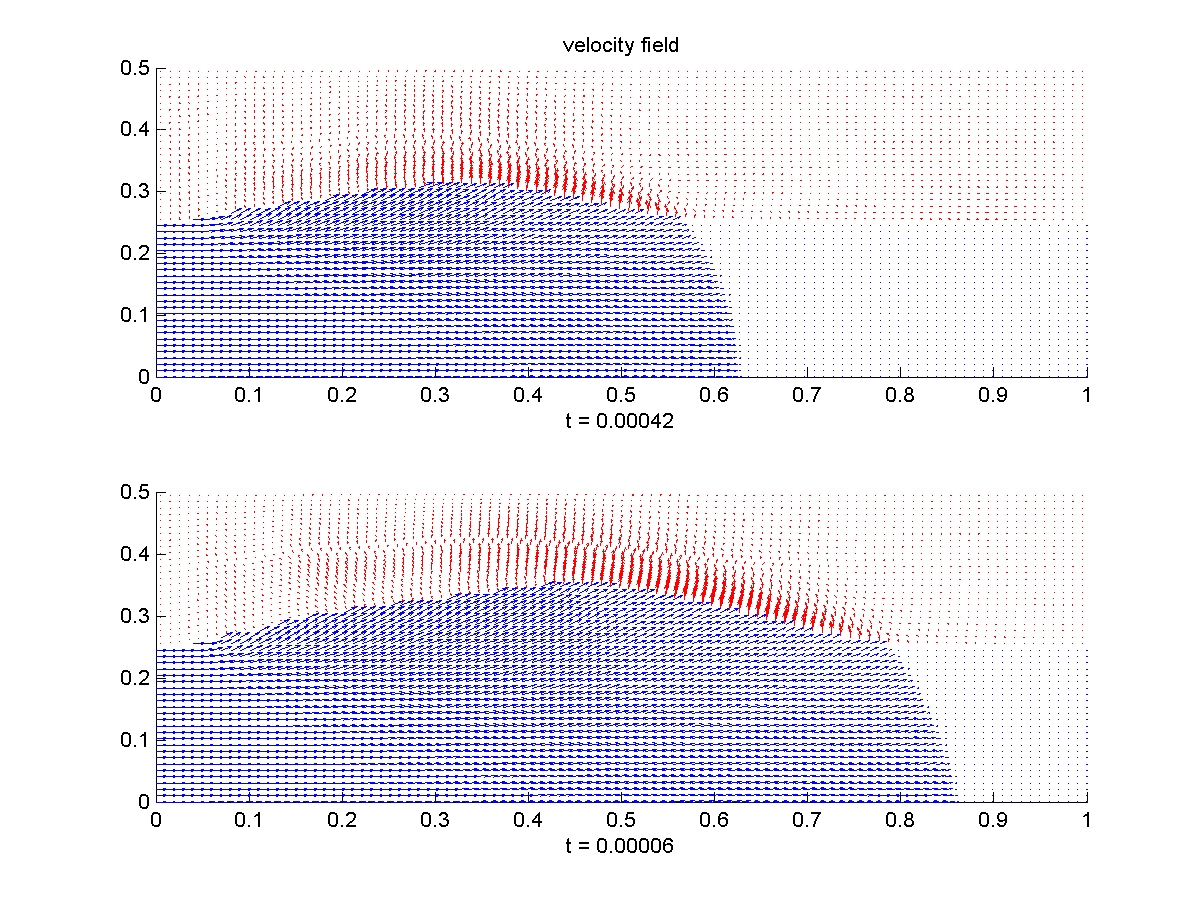
Figure 4. This figure shows
the associated velocity fields for Figure 3.